Skip to content

Continuing Work on Your Report

Continuing Work on Your Report published on

This is the post for the week of April 9, 2017.Your Cheat Sheet for Writing Headlines

Readings for the Week

Review this week’s reading for help with your Genre Analysis Report. These are not new readings, but they will help you with the organization activity listed below.

Tasks for the Week

  1. By 11:59PM on Monday, April 9, submit your 04/06 Labor Log in Canvas, if you are using the grace period.
  2. By 11:59PM on Monday, April 9, submit your Progress Report in Canvas. If you are using the grace period, submit your progress report by 11:59PM on Thursday, April 12.
  3. Review the readings above and sketch out a table of contents (TOC) that covers the required sections of your report. Be sure that your TOC informs your readers about the report’s contents. Incorporate your TOC in your Genre Analysis Report draft.
    Today’s infographic outlines some ways that you can write headlines, which can inform the way that you create information rich headings in your TOC.
  4. By 11:59PM on Friday, April 13, write your 04/13 Labor Log in Canvas. The grace period for your log entry ends at 11:59 PM on Monday, April 16.
  5. Be prepared to share a draft of your Genre Analysis Report with your writing group for peer review by 11:59PM on Wednesday, April 18.


Note: This infographic already has a transcript.


#WeekendWatch: Video Progress Report

#WeekendWatch: Video Progress Report published on 9 Comments on #WeekendWatch: Video Progress Report

There may be times in your work that you will use video to share a progress report. For example, you might record a walk-through of a space you are building to show your stakeholders the progress you have made. A game developer might demonstrate the latest features in a game as progress report on the next version. In any career field, you might make a video of a slideshow-based progress report with audio commentary so that stakeholders can watch the show on their own time.

Today, I have a video progress report on Charlie, a service dog in training to work with a U.S. veteran who has a disability. The Today Show is working with America’s VetDogs to follow the work that goes into preparing a service dog and highlight how the animals help veterans.

This Today Show video is a very informal progress report. It would not work for every audience; but it does demonstrate Charlie’s progress. Listen for details on what Charlie has learned and what will happen in the future as he continues his training.

From The Today Show: TODAY’s Puppy With A Purpose Charlie On His Way To Becoming A Valued Service Dog


Note: This video has closed captioning, so it does not need a transcript.


#FridayFact: Deal with Trouble in Advance

#FridayFact: Deal with Trouble in Advance published on 16 Comments on #FridayFact: Deal with Trouble in Advance

Infographic: How to Beat Deadline StressAt some point, you are going to face a challenge that threatens your progress on a project in the workplace. No matter how hard you work, it’s bound to happen. Sometimes it’s your fault. Sometimes someone else is to blame.
Regardless of who is responsible, the important question is how you will respond. You have to decide what you can do that will preserve your (and/or the company’s) reputation while still satisfying the needs and requirements of your client.

That is where today’s #FridayFact comes in: The best strategy is to let people know of problems immediately. I don’t mean call the stakeholders in a panic, of course. Meet with your team or your manager, and figure out how to handle the situation.

As soon as you have a plan, let your stakeholders know. Tell them what happened, why it happened (if pertinent), and what you are going to do. Don’t blame anyone. That doesn’t help. Focus on how you will do your best to get the project in as close to the deadline as possible.

Sometimes you need your stakeholders to help with the solution. Perhaps they will need to approve a new supply or a different design. In those cases, you meet with your team to figure out the alternatives and their strengths and weaknesses. Once you have the options figured out, contact the stakeholders with the information, giving them a recommendation for the best choice.

In addition to my suggestions, check out The Muse’s suggestions for What to Do When You Know You’re Going to Miss a Deadline.


P.S. Anyone other than me bugged by the gender representation in that infographic? Notice that it’s all men, except for the suggestion that deals with cleaning. Grr.


Note: This infographic has a transcript.


#InfographicInspiration: Progress in an Infographic

#InfographicInspiration: Progress in an Infographic published on 12 Comments on #InfographicInspiration: Progress in an Infographic

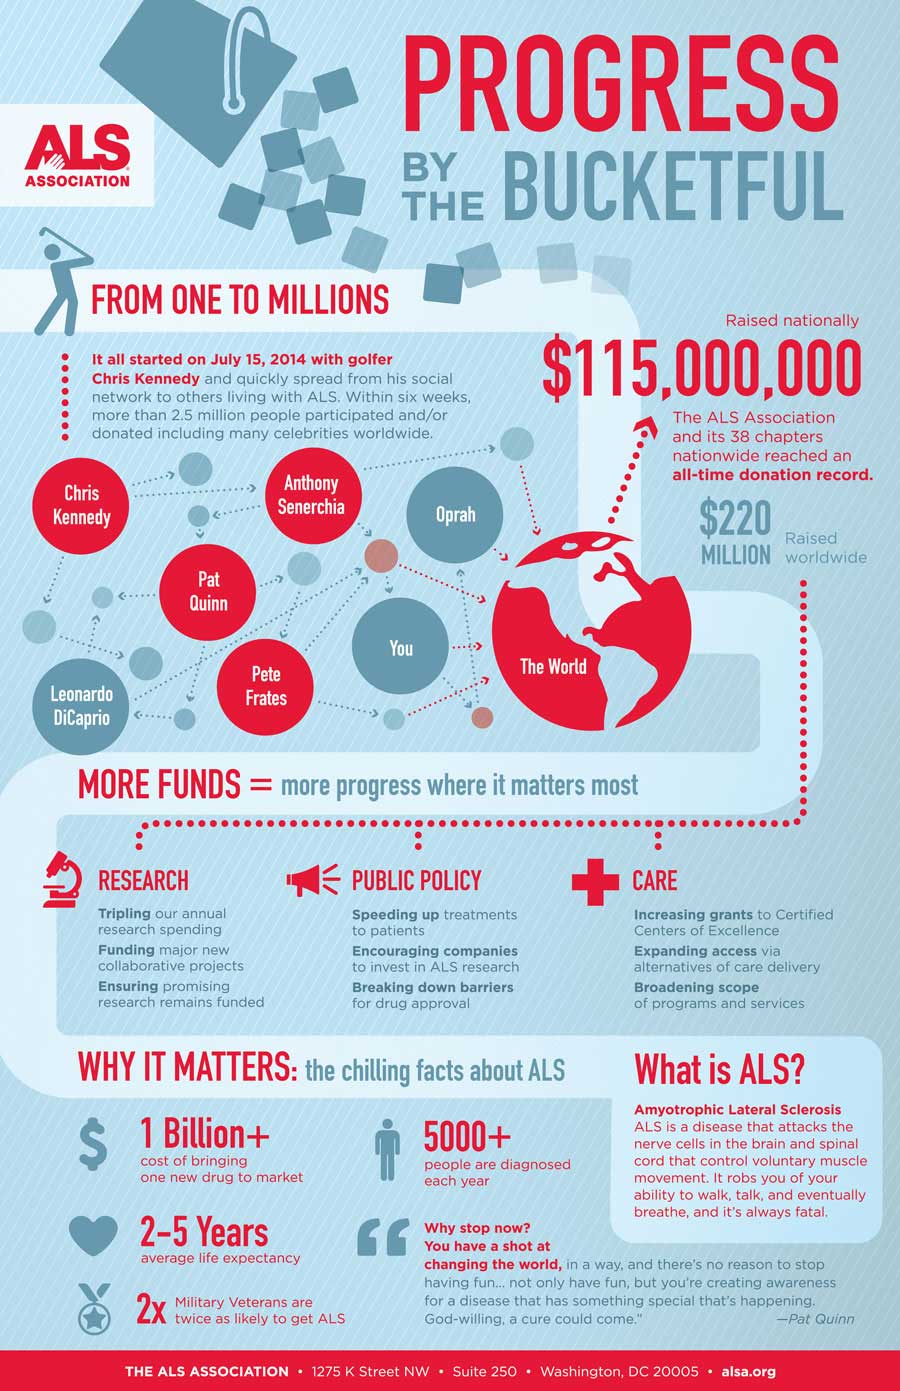
Since you are writing your progress reports this week, today’s #InfographicInspiration is the Amyotrophic Lateral Sclerosis (ALS) Association’s Progress by the Bucketful, which shows the impact of the Ice Bucket Challenge.

This visual presentation of the progress in the work to find a cure to ALS shows the same kinds of information typically included in a progress report: what has happened, what still needs to be done (and why), and how remaining work will happen (in their section, Why Stop Now?). How effective does this progress report seem to you? Does it accomplish its secondary goal of inspiring people to continue contributing to the fight against ALS?

You may also consider what you might include and how you would present information if your progress report were an infographic. Yesterday’s post on visual representation has related ideas that can help you think about how you would create an infographic.

Amyotrophic Lateral Sclerosis (ALS) Association’s Progress by the Bucketful Infographic


Note: This infographic needs a text-based transcript. See the Optional Accessibility Transcript Activity for more details.


#WednesdayWrite: Visualize Your Progress

#WednesdayWrite: Visualize Your Progress published on 14 Comments on #WednesdayWrite: Visualize Your Progress

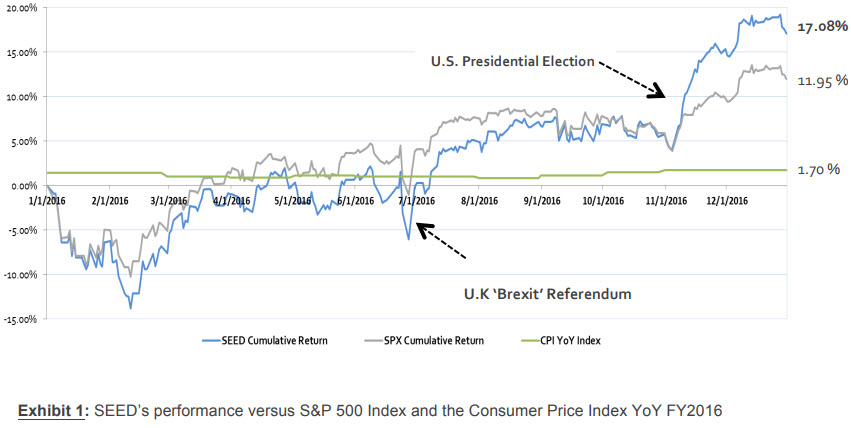
You can often show trends and comparisons with graphical elements than with text descriptions. Consider the difference between describing the performance of a stock or a portfolio during the last year and showing that performance with a line chart. Here’s an example from the Student-managed Endowment for Educational Development (SEED) 2016 Annual Report. Which seems easier to read and process to you?

Text Description

The portfolio performed relatively in line or slightly below the respective benchmark until the final quarter, as shown in Exhibit 1. We included the Consumer Price Index as a preservation of spending power benchmark to monitor changes in our real returns. From mid-November to year-end, the portfolio significantly outperformed and finished 2016 with an active return of 5.13%. In order to calculate our risk-adjusted return, we incorporated our portfolio’s beta of 1.2 and historical average for yields on the 1-Year Treasury note (1.84%) in order to compute a CAPM-based implied alpha. This calculation resulted in an implied 2016 alpha of 3.11%.

Line Chart

SEED 2016 Performance

For my money (yes, a pun), the line chart is much easier to understand quickly. In many circumstances, you will include both a text description and a graphical representation. The point of today’s post is that the graphical version is not just an illustration. It is critical to showing the reader information about the topic.

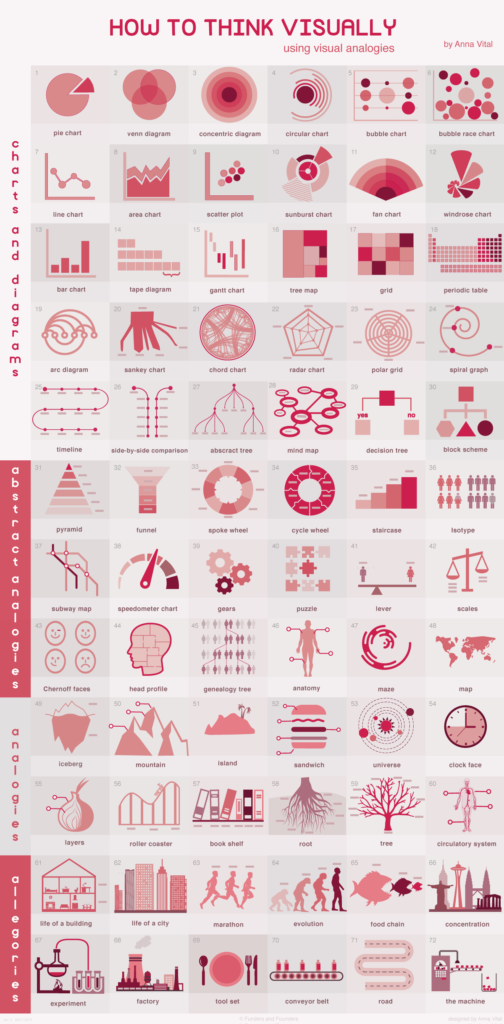
For your #WednesdayWrite, think about how you can add graphical representation of information in your progress report. The infographic below shows a collection of graphics you can use to communicate information. Visit the post How to Think Visually Using Visual Analogies from Anna Vital for a larger version of the image and short details on the various kinds of charts and graphs.

Once you explore the options, add a comment that discusses a graphical representation that you might use in your Progress Report. Talk about what you have chosen, how you will use it, and why it will be effective in communicating with me about your progress.

How to Think Visually Using Visual Analogies

Source: How to Think Visually Using Visual Analogies from Anna Vital

Note: This infographic needs a text-based transcript. See the Optional Accessibility Transcript Activity for more details.


#TuesdayTutorial: Progress Reports for Clients and Stakeholders

#TuesdayTutorial: Progress Reports for Clients and Stakeholders published on 9 Comments on #TuesdayTutorial: Progress Reports for Clients and Stakeholders

Lynda.com Login Help

Lynda.com videos are free to Virginia Tech students with your VT.EDU login. Start at the VT.EDU login page to access these resources.

On Monday, you will submit an internal progress report. It’s similar to the kind of progress report that you might give to your manager or co-workers to let them know what’s happening with a project.

You also need to know about how to write external progress reports, which will go to clients or stakeholders outside your organization. While the general purpose is the same as that for an internal progress report, the audience is quite different.

The Lynda.com video Using in-progress reports to communicate with clients (4m 23s) will walk you through the key features and the important characteristics of this kind of progress report.

Screenshot from #TuesdayTutorial: Progress Reports for Clients and Stakeholders


Note: This video has closed captioning, so it does not need a transcript.


Progress Report Overview

Progress Report Overview published on

This is the post for the week of April 2, 2018.

Progress Report by Forest Hill Society on Flickr, used under a CC-BY licenseThis week you will continue writing your Genre Analysis Report, and you will write a Progress Report that tells me about your project.

This is a one-page assignment with a fast turn-around.

Based on a suggestion regarding website organization, I will begin duplicating posts from the Course Website in the Announcements in Canvas. The information is the same. The idea is to make it easier to get to.

Readings for the Week

Tasks for the Week

  1. By 11:59PM on Monday, April 2, submit your 03/30 Labor Log in Canvas, if you are using the grace period.
  2. Spend the majority of your time working on your Genre Analysis Report. The more work you get done this week, the easier it will be to finish on time.
  3. Share a draft of your Progress Report in the Feedback on Progress Reports on Canvas by 11:59 PM on Wednesday, April 4.
    • In your message, ask your group to look at anything you are trying to improve. Let them know the kind of advice you need.
    • By 11:59PM on Friday, April 6, provide feedback to your group members, using the strategies in the Peer Review Commenting Strategies video.
    • Revise your Progress Report, using the feedback from your group members. Be sure to add any details on work you have completed since you wrote the first draft.
  4. Submit your Progress Report in Canvas by 11:59PM on Monday, April 9. The grace period ends at 11:59PM on Thursday, April 12.
  5. (Optional) Fill out the Completion Checklists for Midterm and for March to track how you are doing in the course. You can read more about how the checklists work in the Changes to the Course Grading System post.
  6. By 11:59PM on Friday, April 6, write your 04/06 Labor Log in Canvas. Specific questions for your log are included in Canvas. The grace period for your log entry ends at 11:59 PM on Monday, April 9.

Photo credit: Progress Report by Forest Hill Society on Flickr, used under a CC-BY license.


Primary Sidebar