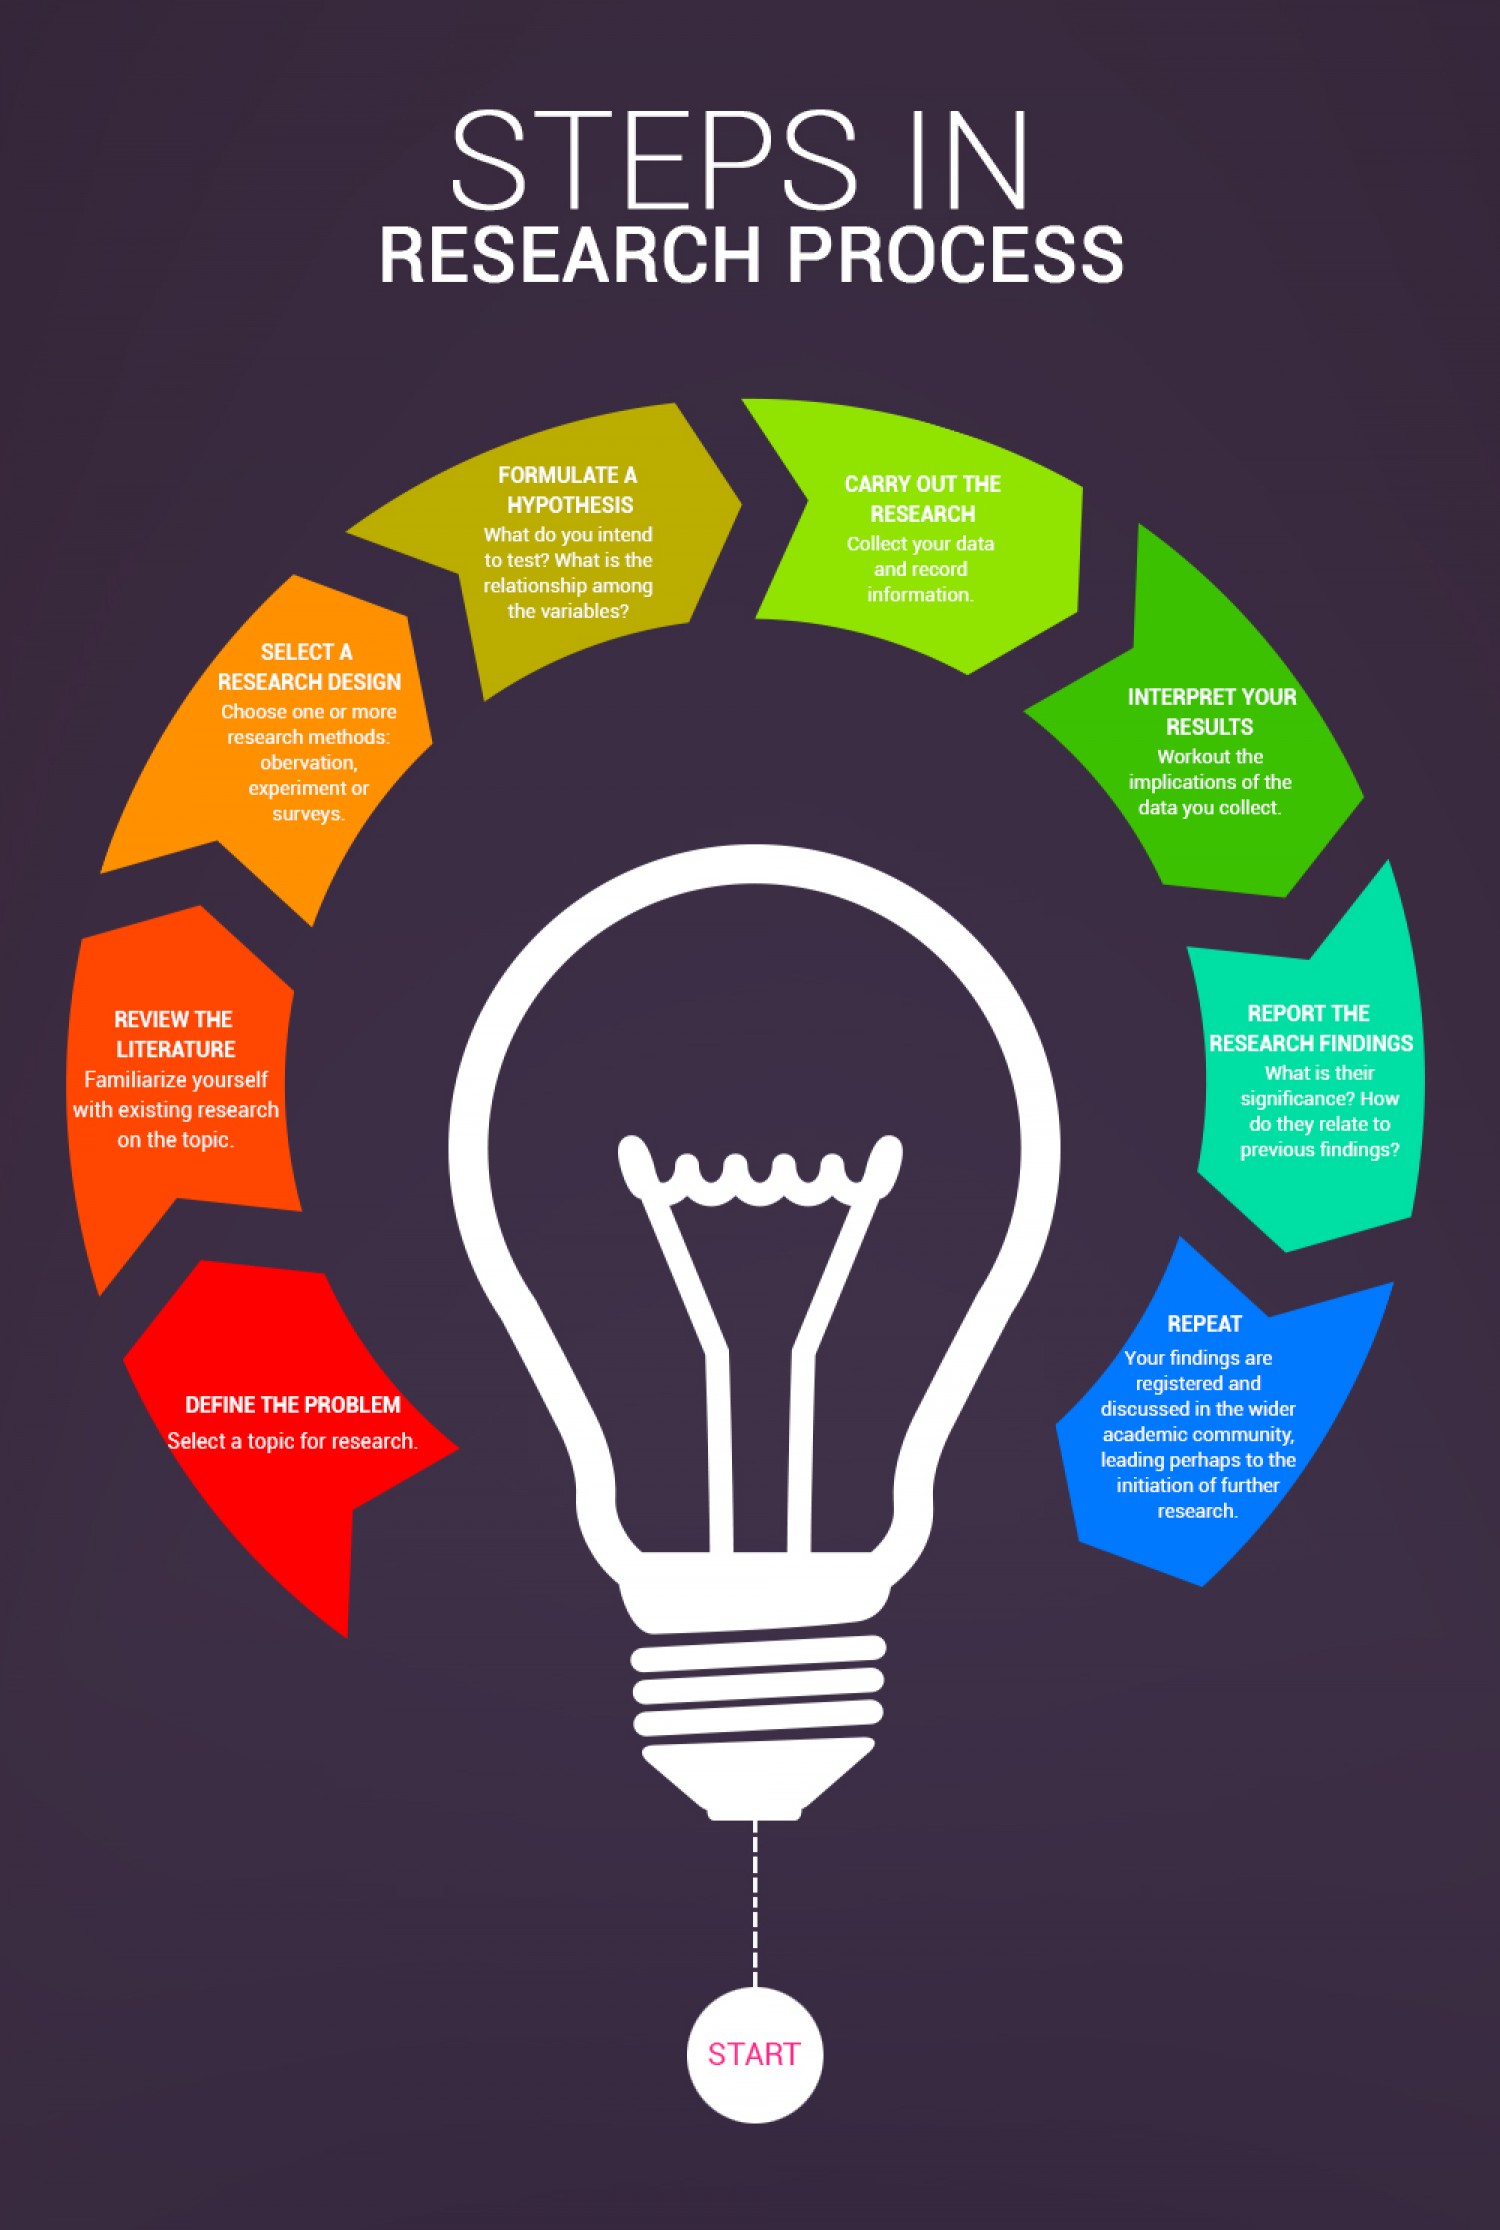
Since you are gathering information for your Genre Analysis Report this week, our #InfographicInspiration for focuses on the research process. The image below breaks the research process into eight steps that are typical for academic projects.
Your Genre Analysis Report probably includes the steps in this infographic, except perhaps the final step “Repeat.” It’s important to realize that research, like most creative projects, can take a much messier route than the infographic suggests. People rarely march through research in a 1-2-3 order. They back up, jump ahead, and redo.
As you look at this infographic, compare it to the way that you usually work. You might comment on any of the following:
- How is your process the same as the one in the infographic?
- How is your process different than the one in the infographic?
- What steps do you follow that are not represented in the infographic?
- If you created a visualization of your research process, what would it look like?
- If the infographic inspires you to talk about something not covered in these questions, tell us about it.
Click for larger image and transcript
24 Comments
Depending on the topic of the research paper, sometimes I can be a little lost at where to begin. However, usually once I start finding valuable information from the research that I do, it becomes a lot easier to figure out the sections of my paper and to begin writing. I feel like overall how I am going to approach the Genre Analysis Report is similar to the infographic. But, I feel like I would not really be formulating a hypothesis nor doing the repeat step. I feel like formulating a hypothesis is for scientific papers or for reports that you are trying to support your argument. To summarize the steps that I do are: 1) Decide what I want the paper to be about, 2) Research the topic, 3) Make some type of outline that includes all the research information that I have found from each website, 4) Think of what sections I want to have in my paper, 5) Begin writing my paper, 6) Read through the draft and make correction, 7) Get some peer feedback, 8) Submit the paper.
The process in the infographic is very formal and explicit, which is not how I typically do research. I think my process is often a jumble of “formulate a hypothesis, carry out the research, and interpret the results”. I might start with one question when I begin my research, then come up with more as I continue reading. Additionally, I often make an initial interpretation of my results while I’m researching so that I can get an idea of what information I have and what I still need
I agree with my peers below when they explain how their steps are similar in many ways to the format above, but not always as orderly and explicit. For myself, I definitely start with defining the topic, problem, question, etc. before researching, but many times I find myself even altering the question a little after research. A great example of this would be my strategy when writing a research paper: I typically define the main research question and try to formulate a thesis statement, but then after I gather all my information that I have written down, I find myself altering that thesis statement. I find this is a less biased way to work because I am not finding research to necessarily back up my notion before research, but allowing the research to be independent and fair and open to a less biased opinion.
I have seen this research process infographic before but have never really stopped to consider how my own research process may be similar or different to the graphic. I found that I didn’t have as many explicit steps as those shown in the graphic; I tend to just have an informal idea in my head of a topic and start looking to see what I can find. Additionally, I typically only look at existing research when I am actually completing my own research. Something from the infographic that I did like being shown was the “Repeat” step. I think it’s important to note that the process is not a “one and done” thing; as you are researching you may comse across new areas you wish to explore, and being able to circle back and adjust your research is critical.
When conducting research in the past, I have not followed these steps. However, for this research assignment I will try to follow this process. I have never outlined my own process like the infographic describes. However, the descriptions of each step allow me to understand what I should accomplish throughout the process. I never really thought of research involving complicated steps but it seems as if I follow this order I will improve my skills and have much better results.
I think the main way that my research process is different from the infographic is that it is not as cyclical and you cannot just repeat the process. I’ve found as I’m beginning my research process that it has been more iterative, meaning that I have to go back and make adjustments to my original questions based on the research I’ve done. Additionally, I have not really formulated a hypothesis because I’m not trying to test something in this project. Instead of a hypothesis, I just had to come up with what questions I’m trying to answer through the research and my report.
I also liked the question in the section report research findings that says, “How do they relate to previous findings?” I think this would be something good to explore in my report by discussing how the findings have confirmed or denied what I formerly knew about my technical writing genre.
I think the infographic explains the process really well. I know I do something along those lines for the process of developing a research paper. I think that when I’m writing a research paper I have steps in between the process where I double check my findings and make sure everything is accurate. There’s nothing worse than getting to the end of a paper and realizing some of your points don’t match up. So, I would say the only difference between the infographic and how I conduct research is the fact that I look over everything every step of the way.
I definitely don’t follow the steps in the infographic in the way they’re laid out and sometimes depending on the situation I don’t really follow them at all. I tend to need to look more at the big picture before I can start asking questions so most times I actually do research as my first step. Since the topic was to research something in our Analysis of Writing it was easy to go through the different options and look into each of them and then determine which one I had the most questions about. I find that once I’ve determined my question I usually just start writing from there and figure out the rest as I go and I fit in sources wherever I need extra clarification on a topic. I don’t write based off of the sources that I have found as I feel that limits me on where I can go with my thought process.
I think this infographic is spot on to my process when I conduct a research paper/project. More specifically, this infographic exactly represents the steps I took during my Senior Design Project. It is always the most important step to define the problem. This goes with any project such as a design project. If the problem is not properly defined, you may conduct the project out of scope or incorrectly. Reviewing the literature on my design project was reviewing the customer specs and needs to make sure our design fit them. Choosing a method on my design project was brainstorming different methods of fixing the problem such as different designs. Formulating the hypothesis was writing a test procedure and writing out the team’s TST or technical specification table which gave the marginal and ideal values from out test procedure. Carrying out the research is performing our drop test of our design and interpreting our results and analyzing how our design performed and how to improve it. Report the findings will be when we make our final report to our client. It is great to see a visually appealing infographic that perfectly explains how to perform a research or design project.
I can relate very closely to this infographic. For most of my research projects that I work on, I follow a very similar plan of action that is illustrated by the infographic above. I think the only part that I never really considered was repeating the steps. I think that is a great suggestion to make sure that the research project turned out exactly how you planned it out. More specifically, going back through the paper and making sure that you stayed on topic and clearly defined your hypothesis is very important. Also, going back through your research and the report can help spark new ideas or maybe fix up things that might have been poorly articulated or not defined as well the first time around.
The process in this infographic goes through series of formal steps to execute research. My research process includes some of these steps but do not follow the steps as shown. I usually identify my topic first based on my knowledge and experience. I formulate a hypothesis and then start gathering the information I need for the assignment. Once I get the necessary information, I interpret the results.
I feel this infographic would be useful if you had no experience with research and needed a helpful guide to get you started. However, for an experienced research, they know there is no one method. As reflected in the comments, many people follow a route that makes sense to them. While I know there is a cyclical nature to research, I do not think it should be represented by a circle. The way I envision my own research is almost like a flow chart where you can return to the initial question at any point. I find when researching I create my questions than I get answered as I am also learning more information that I want clarification on. And even when I feel like my research is sufficient someone else will not and will continue to research. Hence, the beauty of the science community.
For the most part I felt like this infographic did a pretty good job at laying out the research process. However, I think it would need to be reworded or changed a little bit to suit our needs. For instance, in the very first step I would not say that “defining the problem” is the best wording for what we’re doing. I would say that a better phrasing would be “asking the question” about what it is that we want to know. But overall I would say that this is a good infographic and I’ll use it to help guide myself through the genre analysis project.
I made an inforgraphic-like picture to describe my research process! Its very similar to the one described but I am constantly referring back to research literature as I conduct any research. I also start the process with something that interests me, not necessarily a “problem.” I narrow down my objectives later and make a hypothesis. I also noted that i “adjust the experiment” as necessary. I am currently doing undergraduate research working with chickens. Chickens are unpredictable and we have had to change certain procedures as we go!
I post the pic on facebook because I was unsure of how to comment a picture but here is the link!
https://scontent-atl3-1.xx.fbcdn.net/v/t31.0-8/29352335_1489126237863077_6662147851771787863_o.jpg?_nc_cat=0&oh=668489b445b6b0a7098d175dd53c48b9&oe=5B338F23
Im not sure why I cant get the link to work, but it is on facebook!
The process in the infographic is similar to the research process I’ve used in the past, except I seldom use the “Select a Research Design” step. The short report proposal and the genre analysis project will be one of the first time I will use that step. I think it is an important step to have, as a research should be planned out before it is executed. In the past, I just start Googling the topic to find a starting point. Then, if I decide that an interview or survey would be helpful halfway through, I’d just add that part in. I am hoping that since I have all the areas of my research planned out in my proposal using all the steps above, the research process will be more smooth.
This infographic is very formal and detailed, which will be very helpful when I use it as a basis for when I do my research for the genre analysis project. However, my typical research process is a lot less structured. I do not necessarily have a standard set of steps that I follow every time I do research. Typically, I simply start with my general question and begin developing a background about the topic. From there I will analyze the results of the research, and then formulate my thesis. Then I organize my research into similar subtopics, which become the basis for arguing my thesis. I think this infographic covers all the steps that I usually include in my infographic, and more. If I were to visually describe my research process it would probably look similar to the infographic, or a sort of branched system.
After looking at this infographic, it appears that I conduct my research very similar to the way it is displayed here. When I conduct research I always formulate a hypothesis and review literature before I start the main research. Then once I have gathered all my information I interpret my results and see how close they were to my original hypothesis. Then I repeat this process over and over. I think this picture is a very good model to follow when conducting research. By following all these steps anyone can turn into a research expert.
The processes showing on the infographic are very clear and formal which gives me a great path for my researches. Typically I do my research by first, make a hypothesis, then searching on the internet for many information about the research. But I always lose my way when I’m doing the research because the hypothesis is not very clear and I always be dispersed by looking random things online. This inforgraphic gives me a clear way to doing my research and it seems very decent. I will definitely try this progress when I’m doing my analysis project. The thing is sometimes it’s not easy to make every part clear, I might lose track as well by using it. But I will give it a try.
Unlike the infographic, once I define the problem for my research, I immediately carry out research and try to find information that supports my claim. Unfortunately, I usually take ages to find information. This could be because I look in the wrong places, or it could be because I jump straight to the actual research part without much preparation. If I had to create a visualization of my research process, it would probably be just the two steps; “defining the problem”, “carrying out the research”, and “reporting the findings”. After reading this infographic, it is safe to say that I can approach a research paper more effectively.
Being a Building Construction major we are rarely assigned research papers, if ever. So, I don’t really have a process for putting together this type of assignment. I have a general idea of how I would go about gathering and analyzing information and subsequently putting it all together, but this infographic definitely gives me a better guideline to follow.
I have a quite similar flow of working steps with the infographic in terms of starting with reviewing all the literature that I can use for my research topic. For example , as I will be doing a research on how to write a formal technical report so I would start with doing a quick online search of various readings that give out detailed information about this topic. Then, when it is time to interpret the results then I will need to compare those resources to compile a solid structure for the report contents.
This infographic is really clear and easy to understand, and I think this article gives me a simple structure of Genre Analysis Report. Before I read this article, I am really confused about how to write a Genre Analysis Report, and what should I write in this project. I think I can make a list of this infographic, and write down my information on it, which can help me to check.
Like many software engineering methodologies that have well-delineated linear steps and pretty graphics, I think the sort of research process described in this infographic is useful as a rhetorical and learning device but ultimately not realistic in practice. It’s more likely that every one of these steps is continuously considered and performed almost in parallel.
I generally write in order to work out an understanding about something and to figure out what I think about it; the writing itself is a process of discovery and I never know what I think about something, much less what I’m going to say, until I’ve written something and, as a result, reached a greater level of understanding and clarity of thought about it. But that writing doesn’t happen in a vacuum; it involves all of these steps.
There is certainly value in iteration and progression through a methodical process, but rarely can, for example, a problem even be well-defined until after you’ve done a significant amount of research in the first place. It’s more likely that you begin with some vague notion, and through some messy iteration of these steps, ultimately come to the real problem and your conclusions about that problem simultaneously.