Skip to content

#InfographicIdeas: Intercultural and Global Awareness in the Workplace

#InfographicIdeas: Intercultural and Global Awareness in the Workplace published on 23 Comments on #InfographicIdeas: Intercultural and Global Awareness in the Workplace

Today’s infographic focuses on Business Etiquette Around the World. The image outlines how people introduce themselves in the workplace, how business meetings work, and how people interact when dining with coworkers or (potential) clients.

You can include information about intercultural and global influences on the different kinds of writing that you include in your Analysis Table project, so today’s infographic should help you begin thinking about how writing and communication may change depending upon where your audience lives or what they cultural background is.

I’m not convinced that everything in the infographic is 100% accurate. For instance, it seems like a stereotype to think that everyone has to do a solo karaoke performance after dinner in South Korea. Does anyone know?

As you look at the infographic, you can respond to what you see here, following any of these ideas (or an idea of your own):

  • Can you provide details that confirm or challenge claims in the infographic?
  • Can you add information for a country—either something that is missing or a country that isn’t listed?
  • Is there anything that surprises you? anything that you might need help adapting to?
  • Can you share an experience where you did (or didn’t) follow intercultural expectations?
  • Can you tell us more about any of the practices listed here (such as the significance of a practice or why things are done in a particular way in a culture)?

Infographic on Business Etiquette Around the World

Image transcript available


#InfographicInspiration: Put CRAP in Your Document Design

#InfographicInspiration: Put CRAP in Your Document Design published on 14 Comments on #InfographicInspiration: Put CRAP in Your Document Design

Lynda.com Login Help

Lynda.com videos are free to Virginia Tech students with your VT.EDU login. Start at the VT.EDU login page to access these resources.

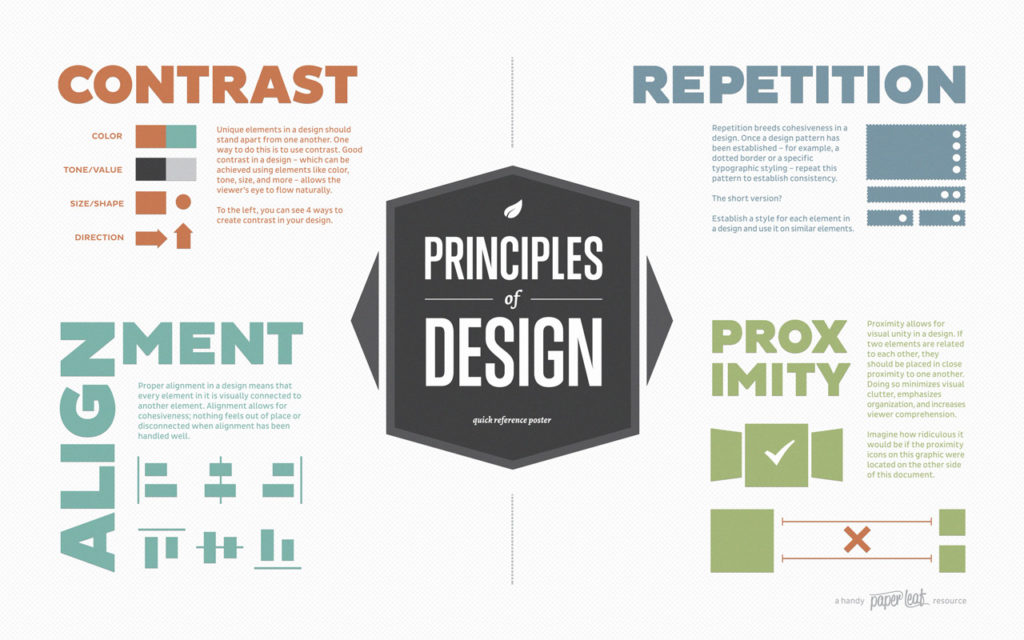
One of my favorite ways to talk about strong document design is the CRAP method. CRAP stands for Contrast, Repetition, Alignment, and Proximity. Using all four of these elements helps give your work a polished appearance and catches readers’ attention.

This week’s #InfographicInspiration (from Paper Leaf Designs) gives you a quick overview of all four elements. It is worth saving for future use, and try applying it to your professional biography assignment before you turn it in on Monday.

For a more detailed explanation of the CRAP elements, watch the Lynda.com video, Understanding the PARC system (Lynda.com was apparently afraid to say CRAP, so they spell it backwards).


Note: This infographic has a text-based transcript.


#InfographicInspiration: Infographic Resumes

#InfographicInspiration: Infographic Resumes published on 29 Comments on #InfographicInspiration: Infographic Resumes

The Professional Bios that you are working on are a kind of career document, like a resume. You are summarizing your qualifications, showing what you bring to a company or organization, and demonstrating how you will fit in with coworkers or what you can do for potential clients.

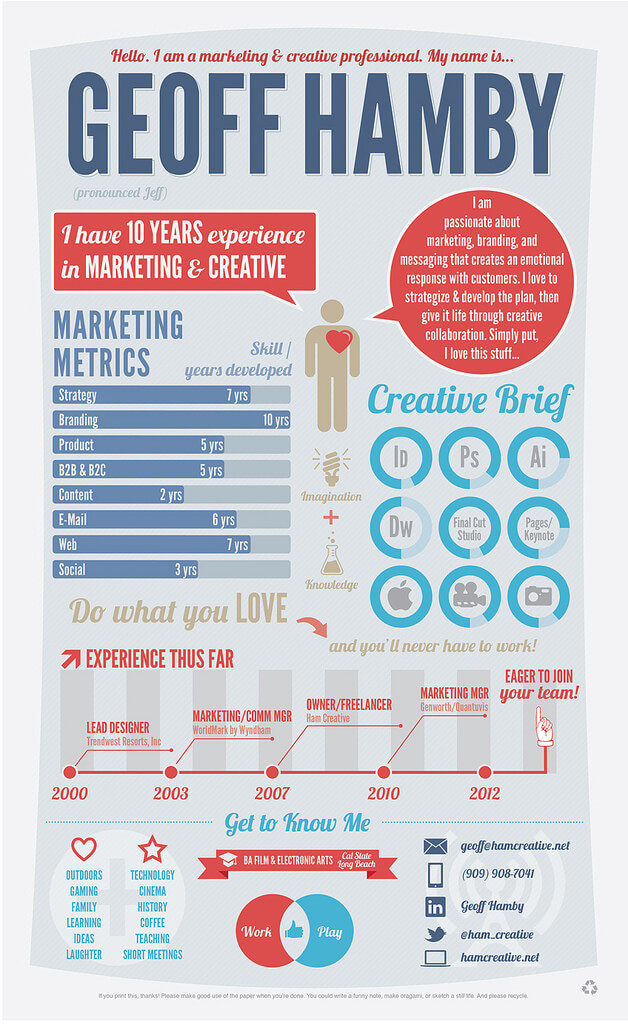
Infographic resumes focus on these same goals, using visuals and document design to highlight the author’s qualifications and accomplishments. These flashy career documents have limited usefulness, of course. Most companies look for more traditional resume presentations.

Please do NOT think that I am recommending that you redo your resume as an infographic. That said, you can gain some interesting perspectives from looking at how document design and visual elements are used in these documents.

Take a look at the infographic resume below for Geoff Hamby and consider how the design and layout highlight the information in the document. You can also consider The Muse’s 4 Rules for Creating a Killer Infographic Resume.

What do you notice in these visual resumes that you can use to make information in your professional bio stand out? How can you use document design and visual elements to present your bio while still fitting into the traditional expectations for a professional bio?

Geoff Hamby Infographic Resume


Note: This infographic needs a text-based transcript. See the Optional Accessibility Transcript Activity for more details.


#InfographicInspiration: Writing Email That Gets Read

#InfographicInspiration: Writing Email That Gets Read published on 37 Comments on #InfographicInspiration: Writing Email That Gets Read

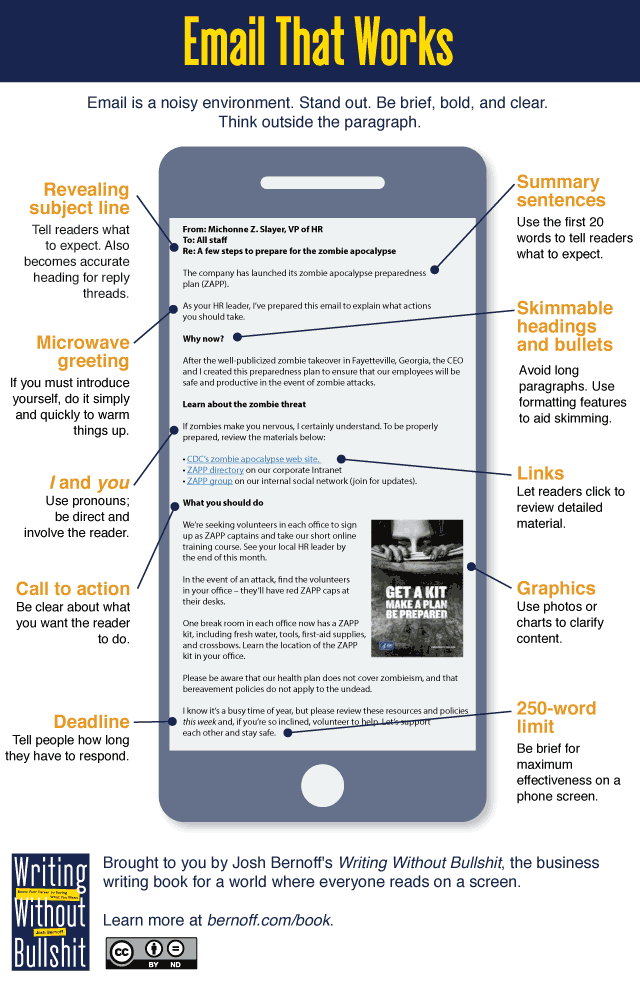
For our #infographicInspiration this week, I’m sharing a simple image that identifies key characteristics of effective email messages.

The website’s name is off-color, but the information clearly and concisely outlines specific ways to improve your email messages. Read more information about the infographic in the article 10 tips for effective email. Compare the parts of an email message that are identified here to those in the infographic from yesterday’s post.

Infographic: Email that works

Note: This infographic needs a text-based transcript. See the Optional Accessibility Transcript Activity for more details.


Primary Sidebar